Use Case: Anomaly as Diversity in Plant Breeding
Optimizing for genetic distance can cause information loss
2021-04-07 by Michael Schmidt in [data science, demo, ai]
The U.N. projects that the total world population will grow from the current 7.7 billion to 9.7 billion by 2050 [1]. In contrast, the land available for crop production is fundamentally limited. The land available per person for crop production is presently near 0.2 ha/capita and expected to drop to 0.18 ha/capita by 2050 [2]. To meet the needs of our world's growing population, the yield of our crops must increase.
To address this need, crop scientists are presently working on breeding new varieties of higher-yield crops. Using modern genetic sequencing techniques, these crop scientists can produce crop varieties with desirable traits while preserving those crops' diversity. The diversity here is essential to prevent a single pathogen or pest from decimating entire species in the future (e.g. the Panama Disease threatening the existence of bananas).
Here we will discuss a surprising result we found in the course of our internal research: optimizing genetic diversity by using genetic distance may actually decrease genetic information.
Assessing genetic diversity
One method used to monitor genetic diversity is to compare an individual's genome to that of some reference genome. To simplify that comparison, crop scientists use genetic distance, which takes two populations' genomes and produces a single number, which increases as the two populations grow apart. If we start with a reference and then select genetics at each generation that are more distant from the reference, we might say we are increasing genetic diversity because we have access to all the lines we have bred in the past. As we shall see, this might not be exactly true.
The breeding pipeline spans several years and requires a great deal of care and resources; thus, it is hugely expensive. Bringing a plant out of the lab/computer and into the world requires personnel, equipment, land, facilities, and lots of time; so it behooves us to bring only the right things into the world.
Though the genome has the potential to store a lot of information, there is not much information on a genome. This low information density creates safety and redundancy (vital to life), but means that much of the genome does not contribute a great deal to the physical manifestation of a plant. This means that much of the genome does not contribute to relevant diversity, so using distance measurements across the span of the genome does not accurately represent relevant diversity.
What if we optimize diversity by optimizing for information instead of distance? Our goal would be to create anomalies — weird plants. Each generation, we would seek to breed plants that surprise us. They might manifest as anomalous genetics that create unsurprising phenotypes, unsurprising genetics that create anomalous phenotypes, or anomalous genetics that create anomalous phenotypes. We would also improve our ability to simulate these things computationally because we would be increasing the informativeness of the training set in the mathematical sense. Practically, we would be increasing the relevant genetic diversity because information, not randomly-located nucleotides, is what makes the plant.
If information is what makes the plant, why do we not optimize for information? Because we need to have an appropriate probabilistic model of genome by phenotype (GxP) interaction. The current workhorse of GxP is general linear models (GLM), which have the distinct advantage of not requiring the huge amounts of data that more expressive models require, but at the cost of dumbing things down considerably. For example epistasis, is a common, non-linear interaction between genes that cannot be captured by linear models. But these sorts of arbitrary relationships are easy for Redpoll's Core platform — even with small data sets — as we shall see in a future post.
Method: Simulating a Crop Breeding Pipeline
We present a simplified and simulated version of a breeding pipeline in conjunction with Redpoll's Reformer system. This simulation allows us to introduce an unexpected change in a crop line's behavior to detect with Reformer.
This experiment's design uses the SLiM 3 forward genetic simulation engine [3] to generate a sequence of generations composed of 50 individuals per generation. Once SLiM breeds a new generation of individuals, chosen by some fitness criterion, those genomes are sent through the analysis pipeline shown in the figure below.
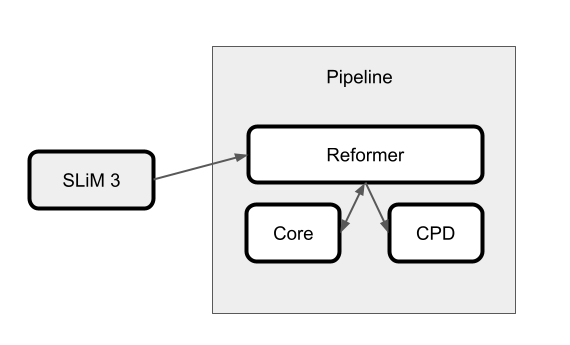
Within this pipeline, Redpoll's Reformer analyzes each generation using Redpoll Core. Reformer can be thought of as a self-awareness system atop Core. Reformer asks intropsective questions about the Core system's knowledge state and can notify scientists of a world-breaking change by way of change point detection (CPD). Here, Reformer will notify the scientist that new generations contain less information and are thus becoming homogeneous.
Here, we configured SLiM to follow three genetic subsequences, each with one possible mutation. Of those three, one sequence, at time zero, will experience a sudden change — a decrease in its mutation rate.
Reformer then returns a report after each generation is processed that contains the information plotted below in the Analysis section.
To understand this process in general, we run it with various (1) seed values and (2) elapsed times before the change occurs (then aligning each plot, so all changes occur at time zero).
Analysis Using Reformer
Here we show a chart of the process outlined above, run 30 times with multiple seed and mutation time lag values. To help you distinguish each curve, they are colored according to the lag before the mutation rate change takes effect (purple: short lag time, yellow: long lag time).
The three plots below show the three values: Nei's genetic distance per generation, mean information content, and a change point detector's probability of a change point.
- Nei's genetic distance [4] represents the genetic difference between the current generation and the ancestral genome used to see the first generation.
- The mean information content is an expression of the diversity of a population. If the mean information content of a generation increases, the population is expressing more diversity, whereas if it decreases, that population is expressing less diversity.
- Finally, the probability of a change point or P(ChangePoint) is the change point detector's probability that a change has occurred. This probability helps automated detections. However, the human eye can often see a change before the software can detect it.
We see here that the genetic distance from a reference genome generally increases over time. In contrast, the information decreases after the mutation rate change. If this line were to continue, the overall genetic diversity would be limited, which may not be desirable.
This behavior could be a valuable alert for the scientific team to investigate further what changes have occurred and save time further down the line.
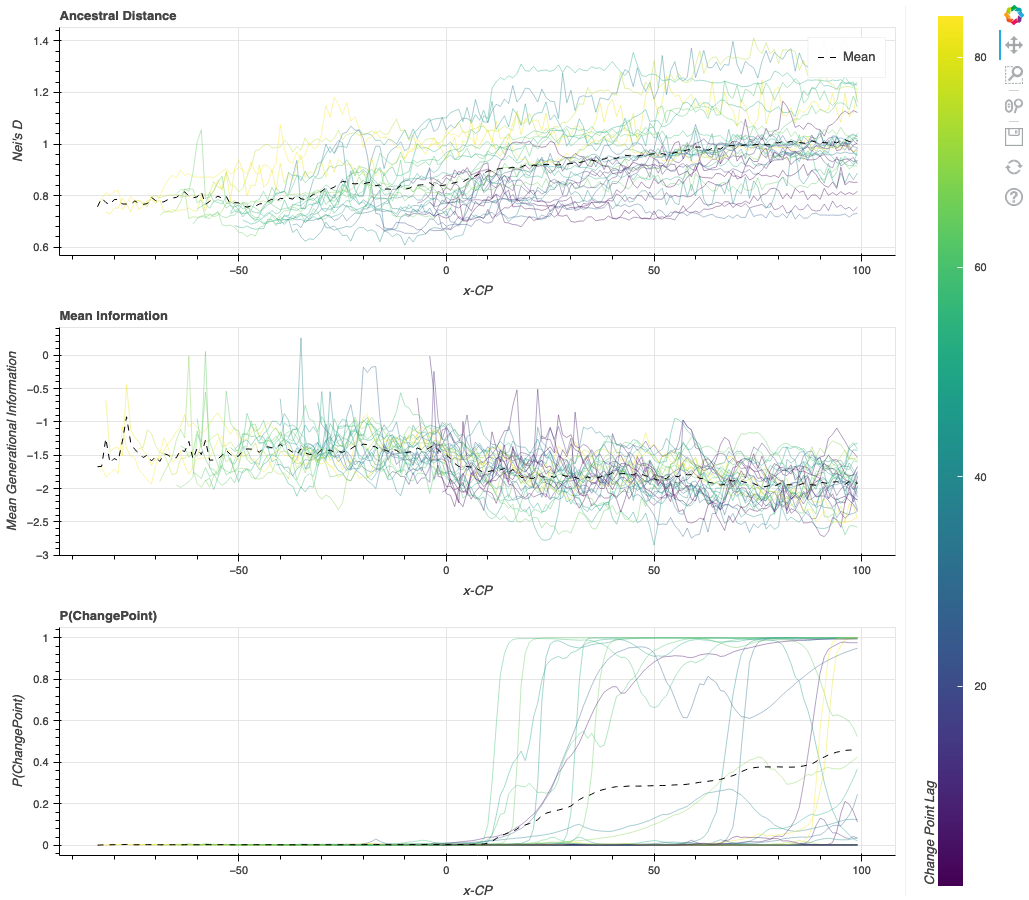
Above: Results from the simulated agronomic pipeline
Discussion
Redpoll Core provides an inference engine capable of modeling complex, nonlinear genetic interactions probabilistically. Reformer exploits these capabilities to monitor information content over time. In many domains, low information is good. It means things are going as expected. High information can be a bad omen. It could be a sign of systematic fraud, an attack on network infrastructure, malfunctioning equipment, upstream software bugs, and more. But observing anomalous data ensures that we better understand the process behind our data. This allows us to make better predictions, and in the case of plant breeding, it allows us to build a more robust germplasm and a more secure food supply.
Citations
- [1] World population prospects 2019: highlights, United Nations - Department of Economic and Social Affairs, 2019 [pdf]
- [2] World agriculture towards 2030/2050: the 2012 revision. N Alexandratos, J Bruinsma - 2012 [link]
- [3] Haller, B.C., & Messer, P.W. (2019). SLiM 3: Forward genetic simulations beyond the Wright-Fisher model. Molecular Biology and Evolution 36(3), 632–637. [DOI]
- [4] Wikipedia, the free encyclopedia. Genetic Distance, Nei's standard genetic distance [link]