Ask and answer questions instantly and transparently
Map the information in your data
Discover which variables are mutually predictive; know which questions you can answer before you ask them.
_ = c.heatmap('depprob', cmap='gray_r', vmin=0, vmax=1)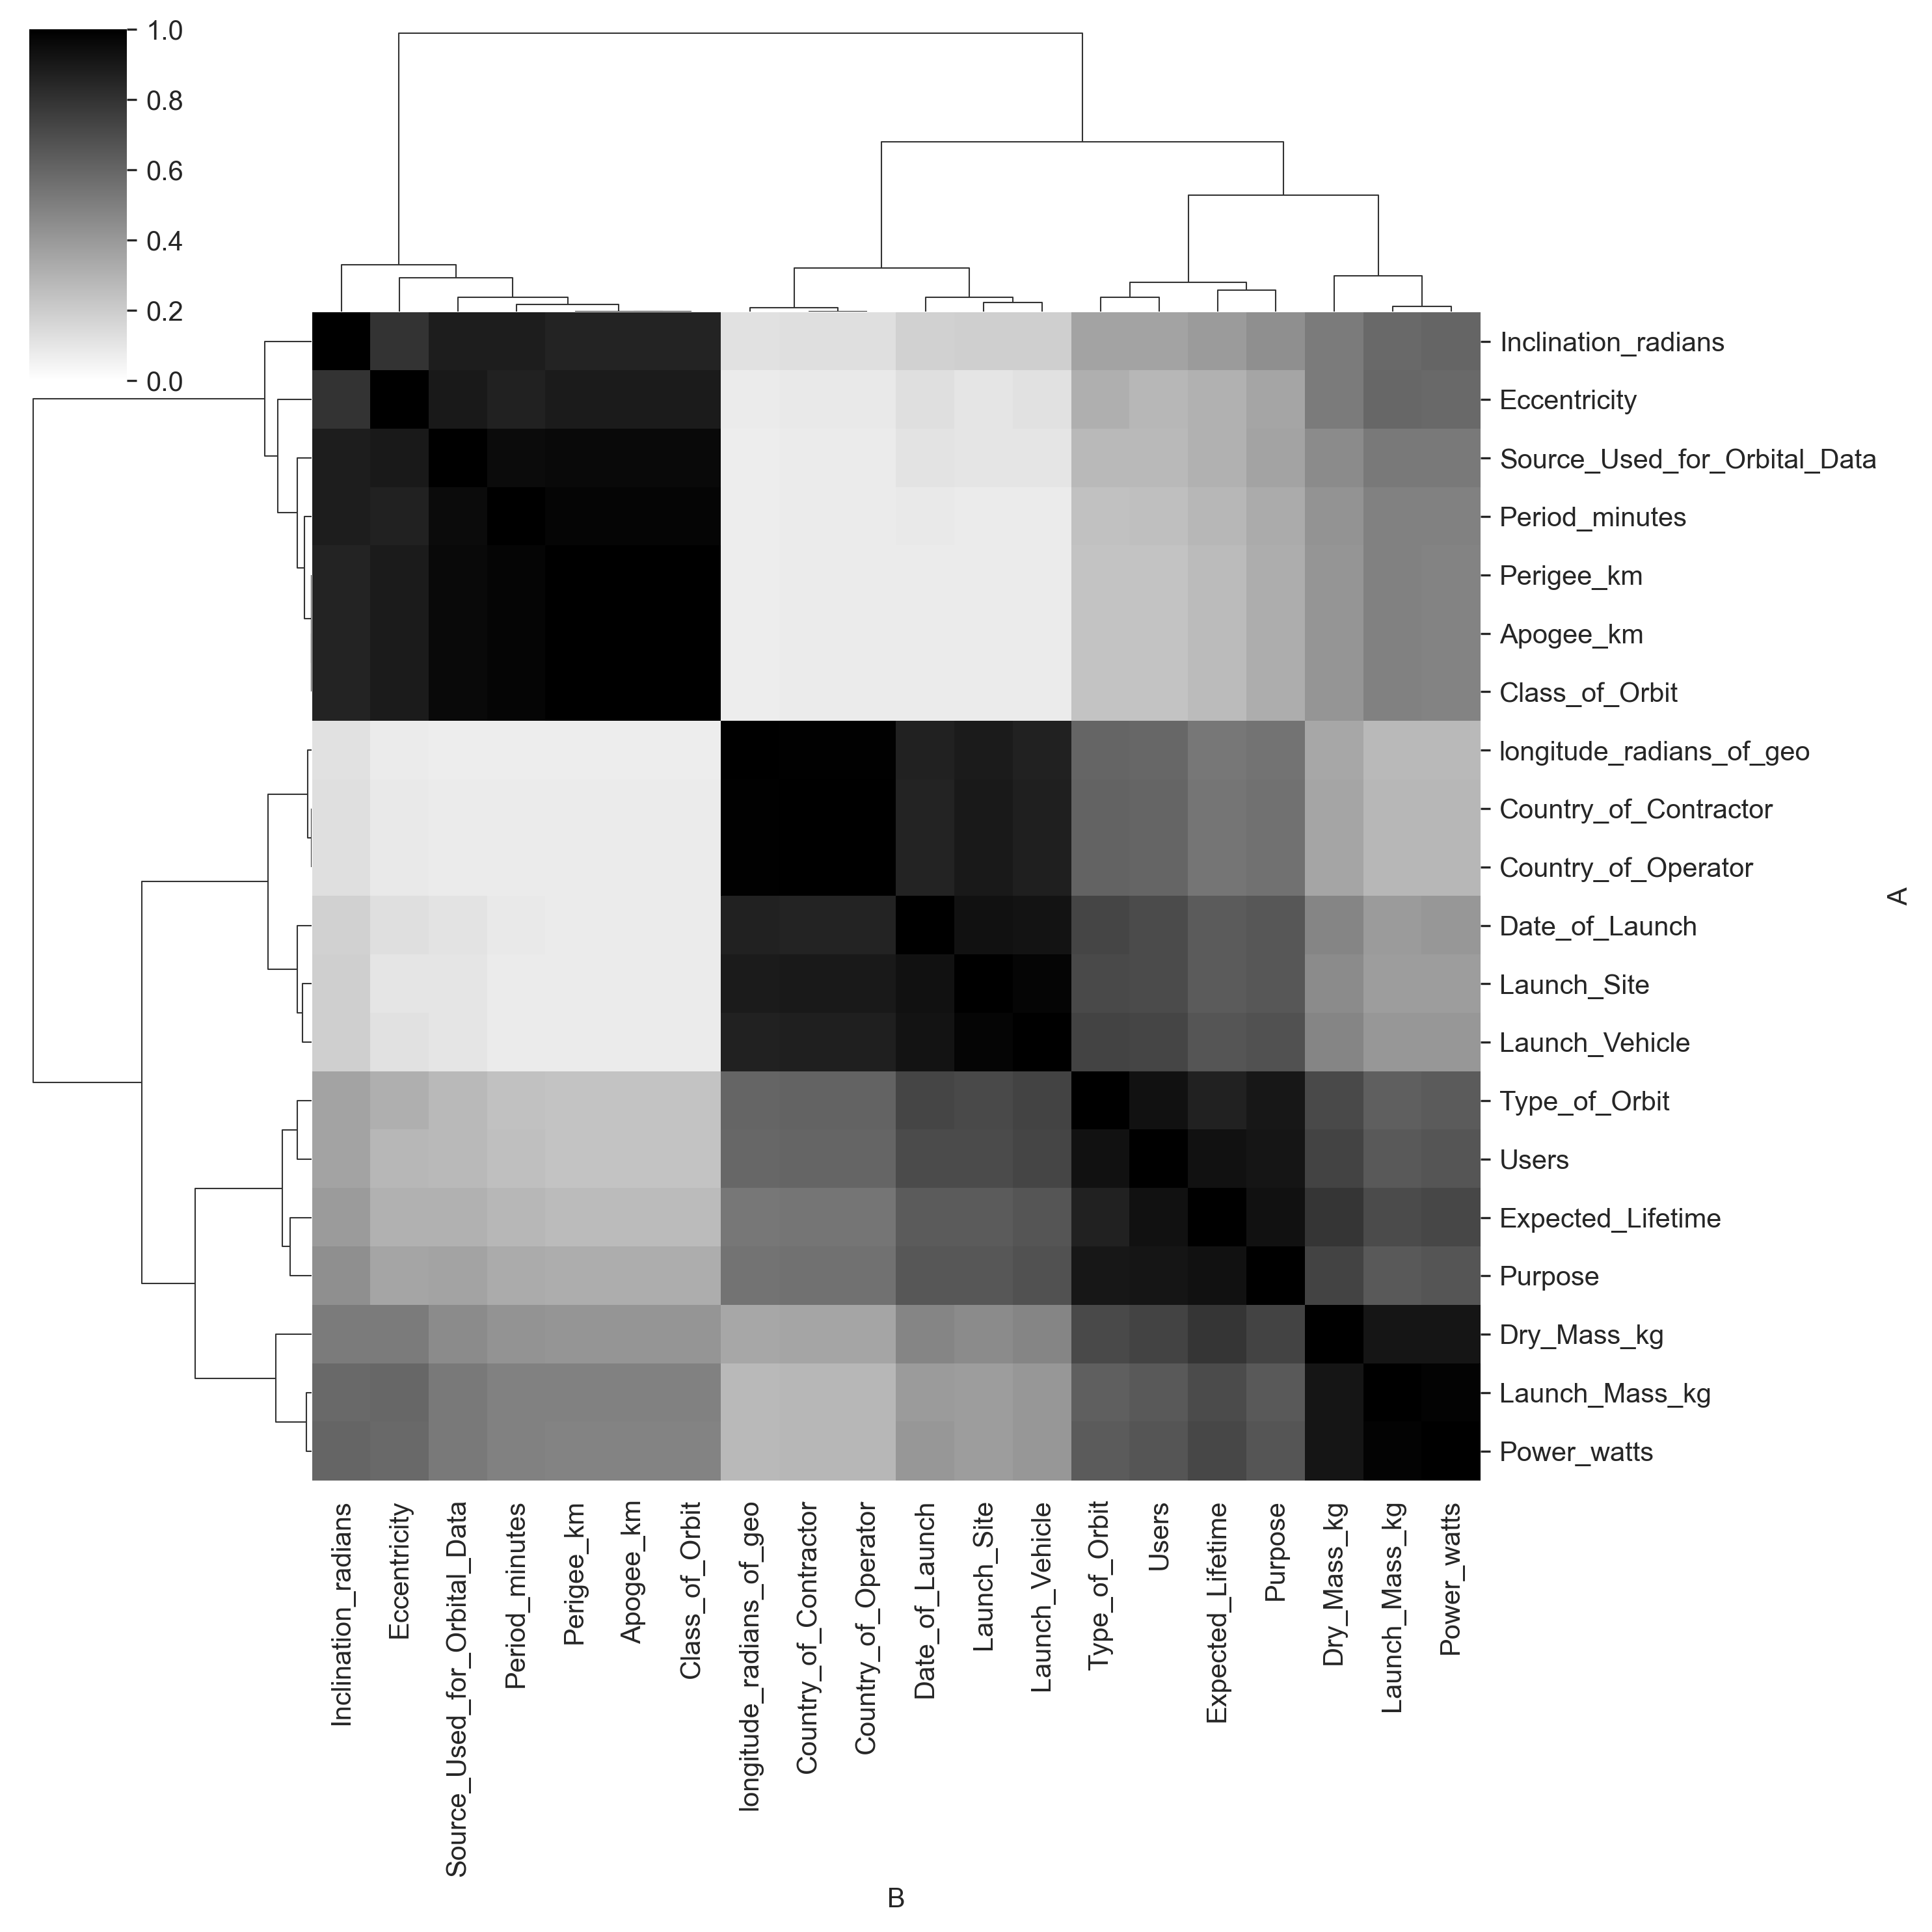
Predict anything given anything
Free yourself from defining inputs and output. Once you've fit a model, you can predict anything in your dataset given anything else (or nothing at all). And Redpoll gives you uncertainty information by default. Always know how confident the model is in its prediction.
pred, uncertainty = c.predict(
  'Country_of_Operator', given={'Launch_Mass_kg': 5000}
)
('USA', 0.09967501286209424)
# Apply confusing conditions
pred, uncertainty = c.predict(
    'Country_of_Operator',
    given={
        'Launch_Mass_kg': 5000,
        'Launch_Site': 'Taiyuan Launch Center'
    }
)
('China (PR)', 0.4270984931675438)
Identify the sources and magnitude of uncertianty
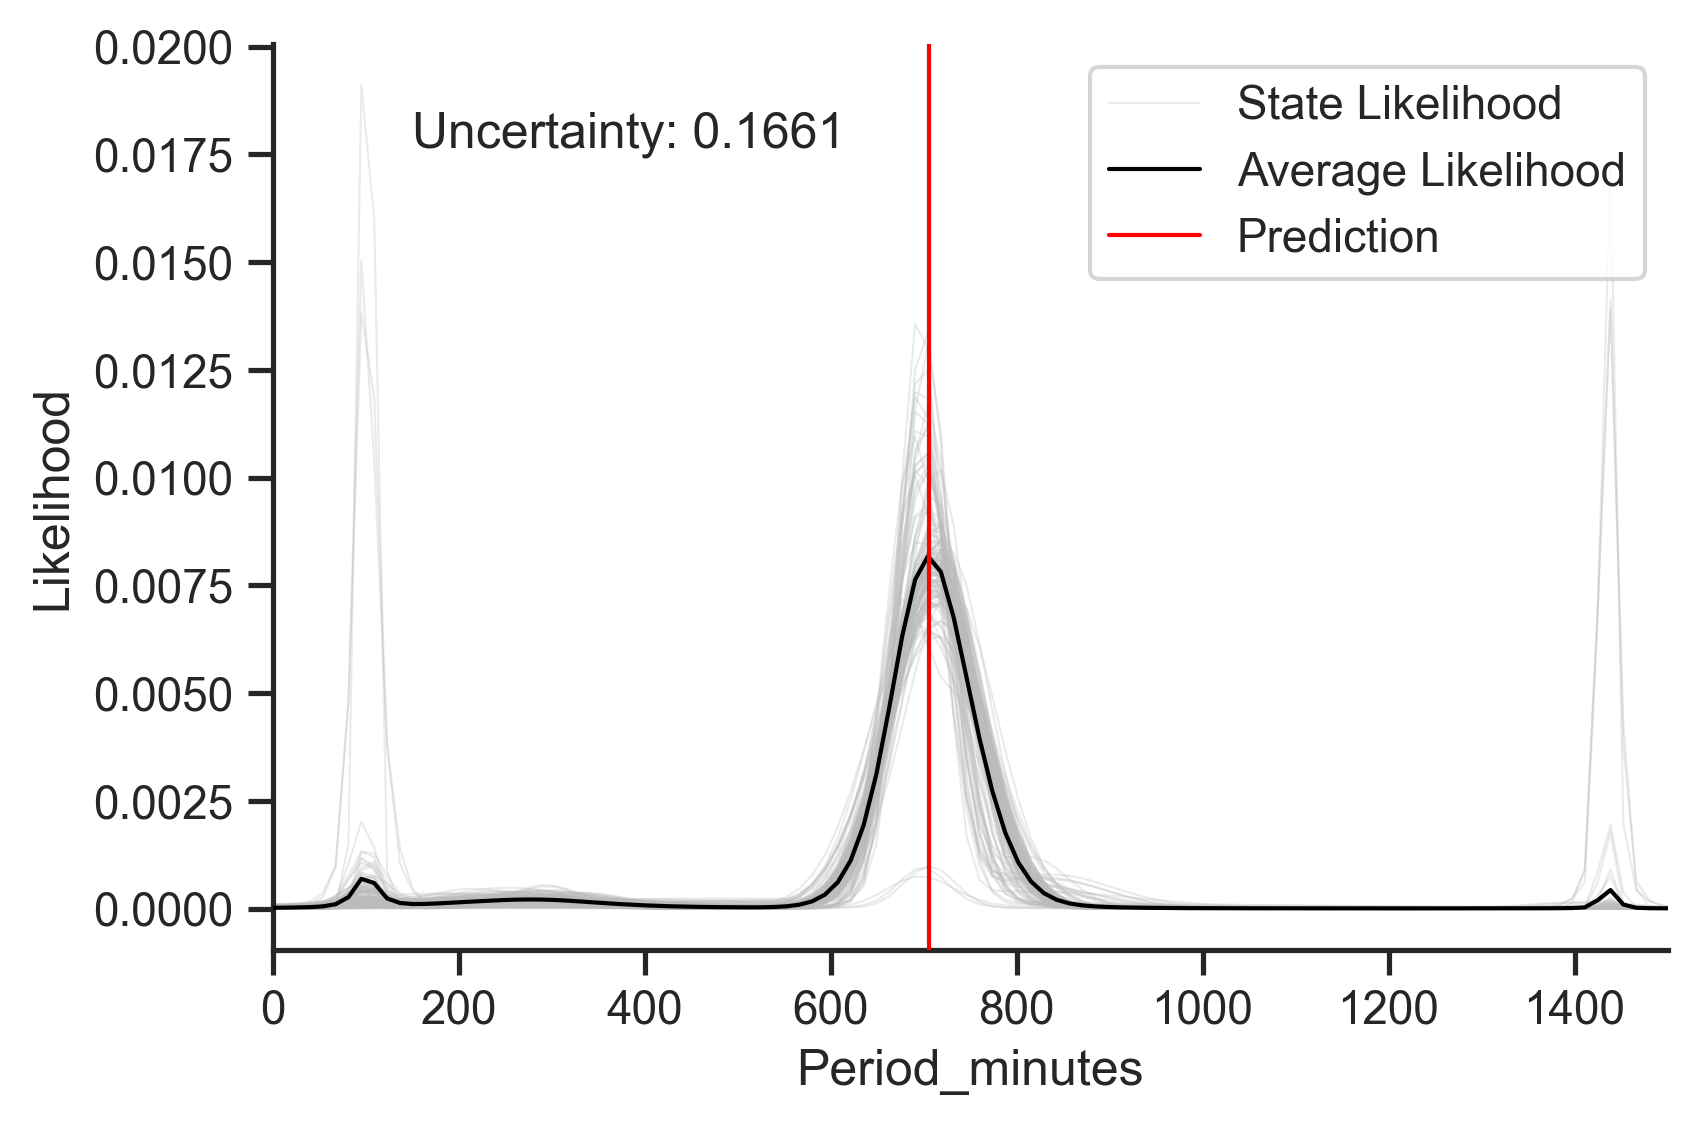
When you predict using today's ML technology you get a number. Take it or leave it. But Redpoll gives you uncertainty information, and allows you to visualize multiple sources of uncertainty so you know when to hold, when to fold, and when to collect more data and what type to collect.
c.pred_plot(
    'Period_minutes',
    given={'Class_of_Orbit': 'MEO'},
)
Identify anomalies and errors
Because Redpoll builds an intuitive model of the process that generates your data, it's easy to intuit when data do not adhere to the model. When you build a model in Redpoll, you get data QA/QC for free.
# 5 most surprising satellites by Orbital Period
c.surprisal('Period_minutes') \
    .sort_values(by=['surprisal'], ascending=False) \
    .head(10)
| Period_minutes | surprisal | |
|---|---|---|
| Wind (International Solar-Terrestrial Program) | 19700.45 | 13.884460 |
| Spektr-R/RadioAstron | 0.22 | 9.523201 |
| Interstellar Boundary EXplorer (IBEX) | 0.22 | 9.494666 |
| Integral (INTErnational Gamma-Ray Astrophysics Laboratory) | 4032.86 | 9.182491 |
| Geotail (Geomagnetic Tail Laboratory) | 2474.83 | 9.143796 |
| Chandra X-Ray Observatory (CXO) | 3808.92 | 8.922031 |
| XMM Newton (High Throughput X-ray Spectroscopy Mission) | 2872.15 | 8.910115 |
| Tango (part of Cluster quartet, Cluster 2 FM8) | 3442.00 | 8.341243 |
| Rumba (part of Cluster quartet, Cluster 2 FM5) | 3431.10 | 8.310921 |
| Samba (part of Cluster quartet, Cluster 2 FM7) | 3430.28 | 8.308759 |
Simulate synthetic data
Generate secure synthetic datasets that maintain the same statistical properties as the original data or create de-biased datasets. Increase the speed of innovation by reducing the barrier to collaboration.
# generate hypotheticals
values = c.simulate(
    ['Launch_Mass_kg', 'Country_of_Operator'],
    given={'Class_of_Orbit': 'GEO'},
    n=10
)

# synthesize a new dataset
full_data = c.simulate(
    c.columns,
    n=c.shape[0],
)
Find knowledge gaps
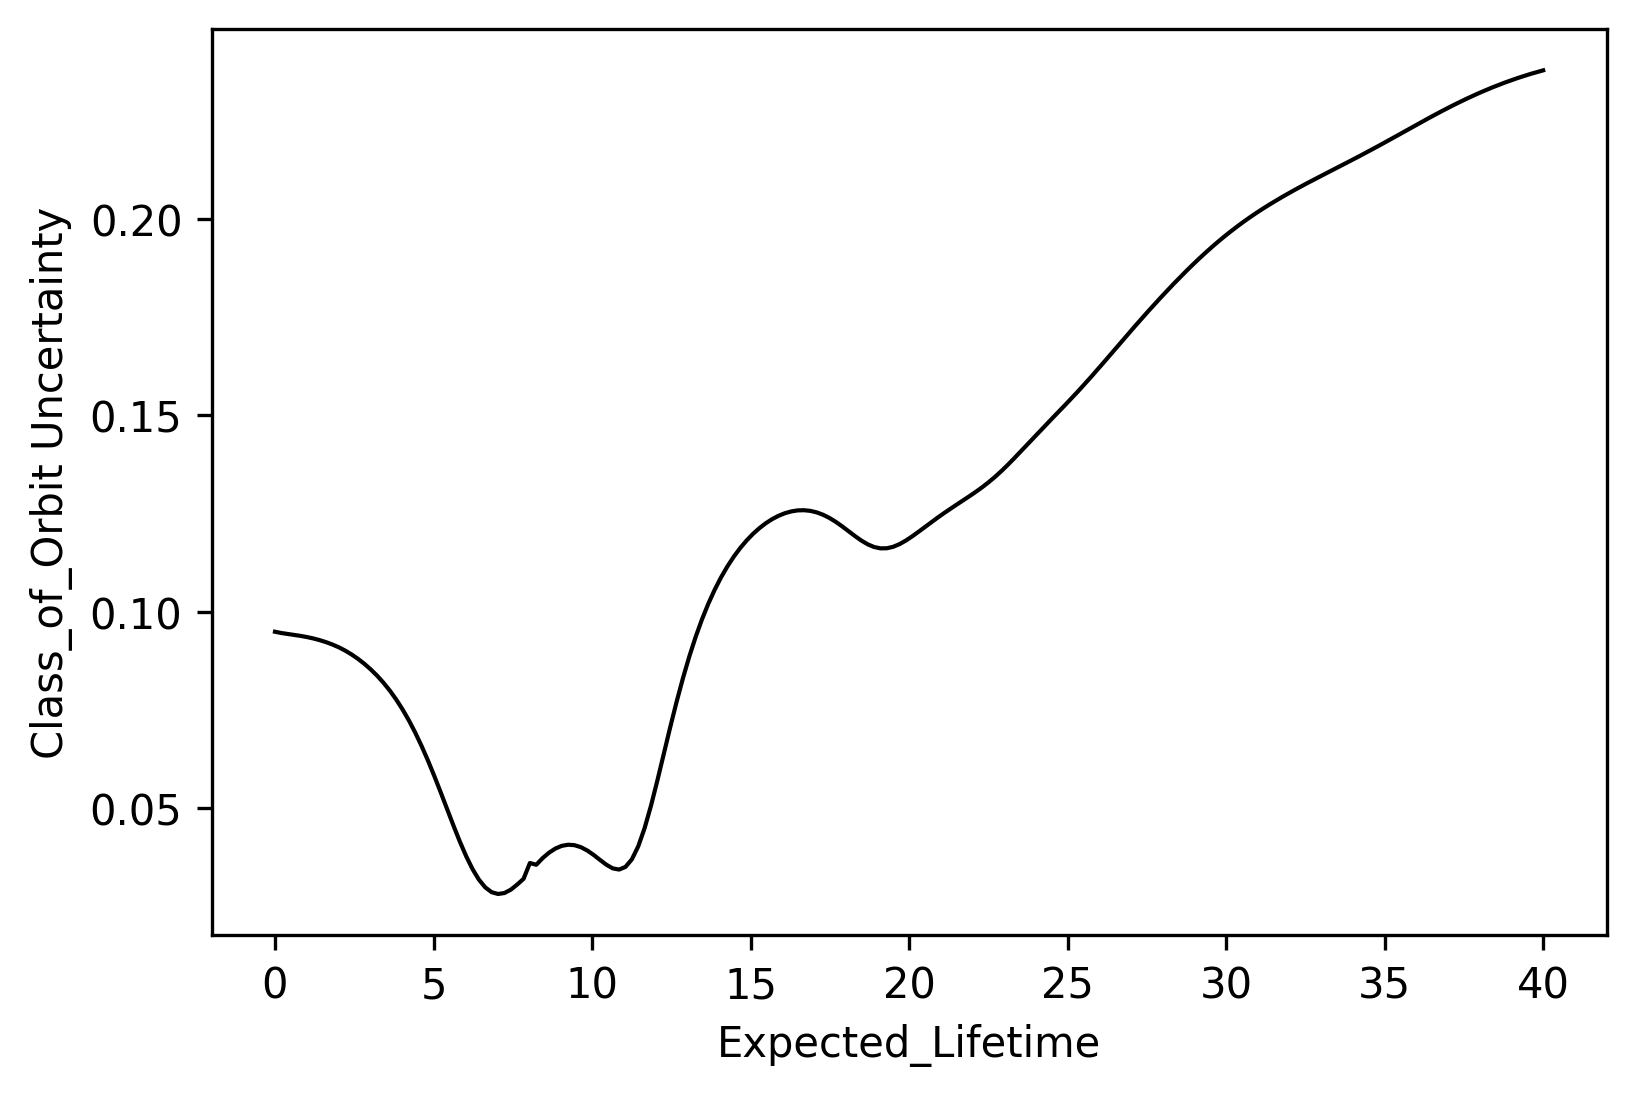
Ever wonder where you need to improve your data — where either messiness or lack of data causes uncertainty in your prediction? With Redpoll, it's easy.
import numpy as np

lifetimes = np.linspace(0, 40, 200)
uncertainties = []
for lifetime in lifetimes:
    _, u = c.predict(
        'Class_of_Orbit',
        given={'Expected_Lifetime': lifetime}
    )
    uncertainties.append(u)